Product note
Reports: what your salon's numbers say, without the spreadsheet
Fourteen reports built from the bookings, clients and stock your team already records: what earns, who is drifting away, where the chairs sit empty and what the next four weeks look like.
SalonRadar · Editorial team
8 min read
In short
- Every report has a period, a comparison, filters, a plain-language summary and an export.
- Client retention names the regulars who are slipping away and lets you write to them in one click.
- The weekly review arrives by email and notification, so the main numbers come to you.
At the end of the month most salon owners know one number: how much came in. The simpler questions are harder. Which service actually earns once you take the materials off? How many regulars have quietly stopped coming? Which hours do the chairs sit empty, and what does that cost? The answers usually get built in a spreadsheet on a Sunday evening, and a month later the whole thing has to be done again.
That is why the SalonRadar dashboard now has a section called Insights → Reports. It holds fourteen reports, all calculated from the bookings, clients and stock records your team already fills in every day. There is nothing extra to type in. This article walks through what is there and what each report is useful for in an ordinary working week.

How every report works
Every report is laid out the same way, so once you know one, you know them all.
- Period. Today, this week, the last 30 days, last month, this quarter, or any range you pick up to two years.
- Comparison. One click to compare with the previous period or the same period last year. Every figure shows whether it went up or down.
- Filters. By staff member, by service category, and by branch if you have more than one.
- Summary. Three or four plain sentences at the top of the report about what matters this period, with suggested next steps.
- Export. CSV for the bookkeeper, or a PDF you can forward to a partner.
One more thing worth knowing: the reports count only visits that happened. If a visit has ended but nobody marked it completed, it is still included, and the report tells you separately how many such visits there are so you can review them.
Sales and operations
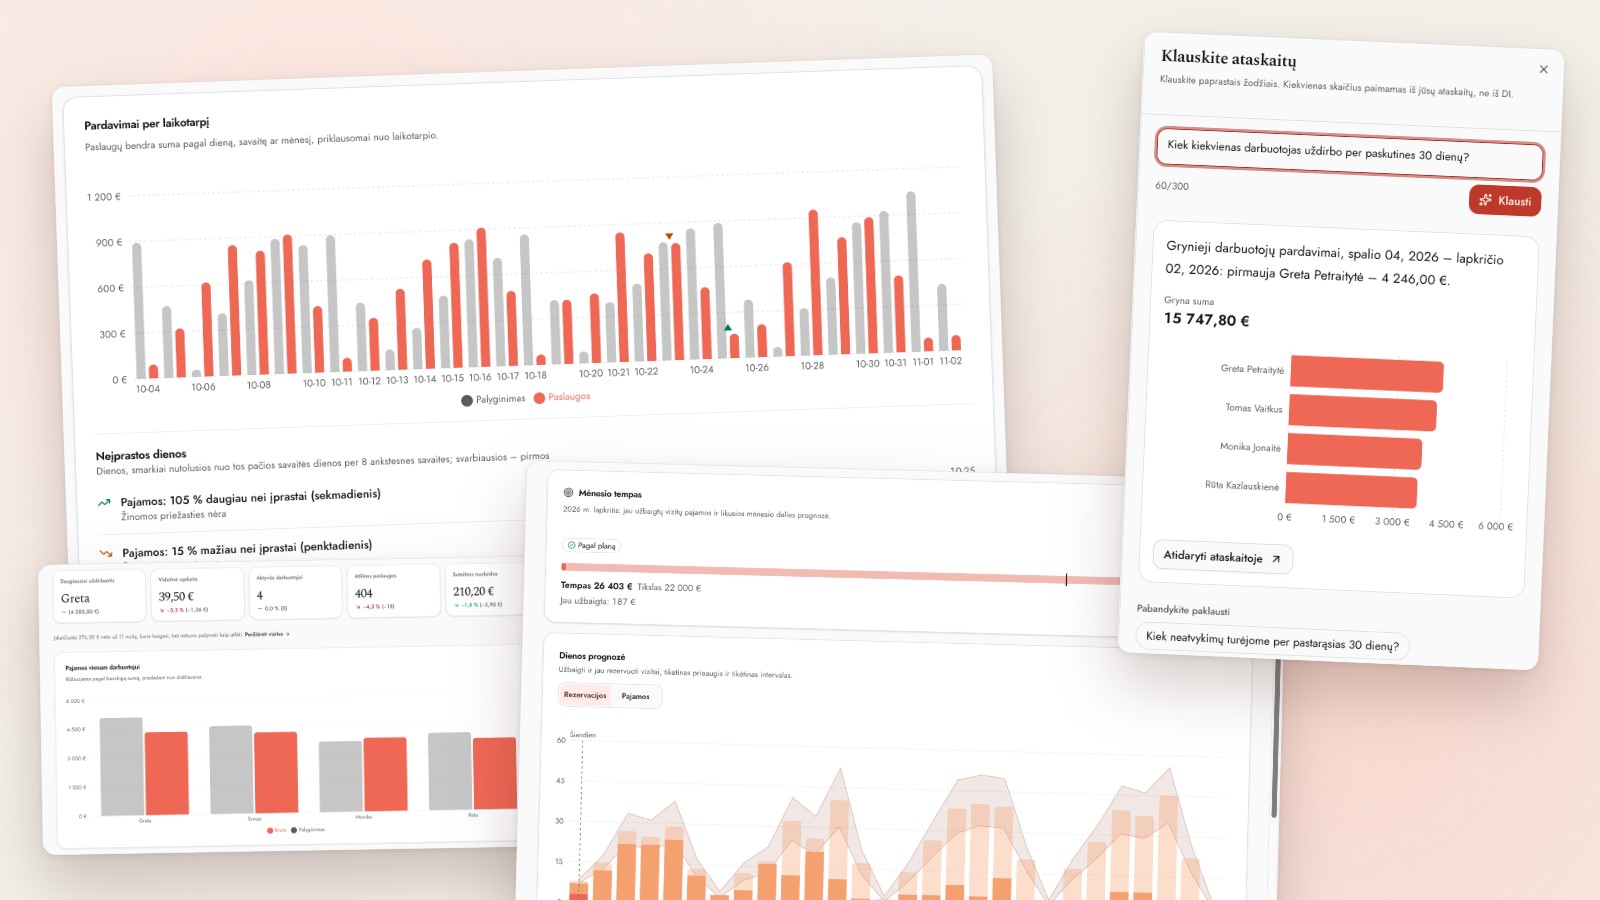
Daily cash close-out and sales summary shows the value of services for every day, the discounts applied and the net amount. The chart compares the chosen period with the previous one, and below it the report flags unusual days, the ones that fell well outside the average for that weekday. If Thursday brought in half of what it normally does, you will see it here, not a month later.

Sales by service answers the question of what really brings in revenue: units, gross, average price and each service's share of the total. It is common to find that the most popular service and the most profitable one are not the same.
Sales by staff lists services performed, gross, average ticket and discounts given for each member of the team. Pick a service category and the figures recalculate for that category only, so you can compare how much colour work each specialist does.

The Appointments report counts booked, completed, cancelled and missed visits. The no-show rate is measured against the target you set, and a day-by-hour map shows when the salon is full and when it is empty. It is the fastest way to see that Friday afternoons are overbooked while nobody comes on Tuesday mornings.

Clients: who comes back and who is drifting away
The Client retention report splits clients into new and returning and shows what share of new clients came back within 90 days. The most useful part is two groups that usually get noticed too late:
- Clients at risk: regulars who are already past their usual rhythm. If someone used to come every five weeks and it has now been twelve, they land here.
- Lapsed clients: regulars who have gone well beyond their usual gap between visits but were still in during the last two years.
Next to both groups you see how much revenue they usually bring in a year, and a Write to these clients button that opens an email campaign with the recipients already selected (only those who agreed to marketing emails). A cohort table also shows what share of each month's new clients returned after one, two or three months.

Channels and campaigns shows where bookings and new clients come from: online or entered by the salon, from Facebook, Instagram or Google, how much each email campaign brought in, and bookings through staff members' personal pages. A separate chart shows at what hours clients book online; a good share do it after the salon has closed.
Staff
Utilisation works out how much of each staff member's shift was booked and how much was idle. It follows the shift schedule, so a day off or a holiday is not counted as idle time. A weekday-by-hour map shows the recurring empty hours, and staff suggestions name them precisely, for example "Saturdays 16:00–17:00: chairs are usually empty", with an estimated value of that idle time and two actions: publish a promotion for that slot or change the shifts.

The Staff scorecard puts each staff member's revenue, average ticket, utilisation, rebookings and no-shows into one table and compares them with the team median. You can set monthly goals for each specialist and follow how they fill up. A staff member sees their own figures under My performance, their own only, not their colleagues'.
Forecast: the next four weeks
Based on the bookings already in the calendar and on how your weeks usually fill up, the forecast shows the likely number of bookings, revenue and occupancy for the next four weeks. The month-pace bar compares what has already been earned, and what is likely to be earned by month end, with the monthly goal you set. Quiet days are listed separately, while there is still time to plan a promotion or a reminder for them.

Stock and profitability
If you use stock management, three reports show where the money spent on products goes. Supply spend is the real purchase total by supplier, category and product. Stock on hand is what the central store, each cabinet and each specialist currently holds, valued at the average purchase price. Specialist consumption compares how much product was allocated to a specialist with how much was used according to service recipes, and shows the difference.
Service profitability joins sales with stock: for each service the material cost is taken off to give the margin and the revenue per booked hour. Next to it you see how your price compares with publicly listed prices at other salons within 10 km.

When there is no time to open a report
Most owners open reports rarely, so the important things come to you.
- Business reviews. At 7:00 on the first day of your week, a review of the week just finished; at the start of each month, the monthly one. By email and as a phone notification, in a few sentences: how it went, what changed and what to look at.
- Scheduled exports. Choose the reports and the recipients, and on the 1st of every month the previous month's reports are sent automatically, to your bookkeeper for example.
- Ask your reports. Type a question in your own words, "how many colour services did Greta do in October?", and you get the number, a chart of it and a link to the report already filtered.

Who can see the reports
Reports are available to the owner, administrators and managers. A staff member sees only their own sales and their own performance. For a bookkeeper or an external auditor you can create a read-only seat: it opens the reports and the payment history but cannot change anything.
Where to start
- Mark visits completed. The reports do it for you once a visit has ended, but the more consistently it is done, the more accurate the figures, especially no-shows.
- Set a monthly goal in the forecast report: one number that every day's pace is measured against.
- Enter recipes for your five most expensive services if you want to see profitability. There is no need to catalogue the whole shelf.
- Turn on the weekly review under Me → Notifications if it is not on already.
You will find the reports in the dashboard under Insights → Reports. If a number is missing, or is not calculated the way you expect, write to us from the dashboard: every report is being refined based on how salons actually use it.